
Fourteen Overs, Sixteen Balls: The Rose Bowl Data Gap and a Method Note
**মূল উত্তর:** রোজ বোল সিরিজের তৃতীয় মহিলা টি-টোয়েন্টি ম্যাচটি টসের আগেই ১৪ ওভারে নামানো হয়, কিন্তু মাত্র ২.৪ ওভার (১৬ বল) খেলার পর দুই দফা পুনরারম্ভের চেষ্টা ব্যর্থ হয়ে ম্যাচটি পরিত্যক্ত হয়; ফলে কোনো ব্যক্তিগত পারফরম্যান্স ডেটা তৈরি হয়নি। **মূল তথ্য:** - Format: মহিলা টি-টোয়েন্টি, রোজ বোল সিরিজের তৃতীয় ম্যাচ, ১৪ ওভারে সংক্ষিপ্ত। - সংক্ষেপণের সিদ্ধান্ত নেওয়া হয় টসের আগেই, ফলে মধ্যপথে লক্ষ্য বদলের অসামঞ্জস্য তৈরি হয়নি। - ভেন্যু নর্থ সিডনি ওভাল; ভেজা সন্ধ্যা, রাতের ম্যাচ, দুই দফা পুনরারম্ভ ব্যর্থ। - মাঠে Averageিয়েছে মাত্র ২.৪ ওভার (১৬ বল), পুরোটাই পাওয়ারপ্লে পরিসরে। - উৎস cricket.com.au: একুশটি তথ্যবিন্দু, ব্যক্তিগত পারফরম্যান্স মেট্রিক শূন্য। **উৎস উল্লেখ:** cricket.com.au (ক্রিকেট অস্ট্রেলিয়ার প্রকাশনা শাখা); প্রকাশের সুনির্দিষ্ট তারিখ উৎস উপকরণে উল্লেখ নেই, স্বাধীন যাচাই অনুপলব্ধ। **সম্ভাব্য ফলো-আপ প্রশ্নোত্তর:** প্রশ্ন: ম্যাচটি কেন পরিত্যক্ত হলো? উত্তর: ভেজা আউটফিল্ড ও বৃষ্টির কারণে দুই দফা পুনরারম্ভের চেষ্টা ব্যর্থ হওয়ায় ম্যাচটি পরিত্যক্ত ঘোষণা করা হয়। প্রশ্ন: ১৪ ওভারে নামানোর সিদ্ধান্ত কখন নেওয়া হয়েছিল? উত্তর: টসের আগেই, ফলে খেলা চলাকালীন লক্ষ্য পরিবর্তনের যে অসমতা তৈরি হয় তা এখানে ঘটেনি। প্রশ্ন: এই ম্যাচ থেকে কী ধরনের ডেটা পাওয়া গেছে? উত্তর: কেবল স্কোরলাইন, দলীয় সূচি, ভেন্যু ও আবহাওয়ার তথ্য; কোনো ব্যক্তিগত পারফরম্যান্স মেট্রিক প্রকাশিত হয়নি।
On the scoreboard the overs column read 2.4. Sixteen balls. A wet outfield at North Sydney Oval, a night match, two false restarts, then a final abandonment. The Rose Bowl trophy did not reach anyone's hands that evening; it went back into a bag. My spreadsheet collected twenty-one information points and sixteen deliveries. That is not enough to write the story of a women's T20I, and the reason it is not enough is itself the story. A sixteen-ball sample does not measure a team's strength; it measures the weakness of our data pipeline.
The real anomaly here is not the abandonment. It rains, grounds get wet, matches get called off. The anomaly is the sequence. The fixture was reduced to fourteen overs a side before the toss. A complete fourteen-over model arrived in our hands, and then we were allowed to watch sixteen balls of it. Someone could call that bad luck. I would call it a test design where the hall is emptied right after the question papers are handed out.
A method note first, because the largest fact in this report is the absence of facts. The evidence base is a single source: cricket.com.au, Cricket Australia's own publishing arm. Twenty-one information points, almost all of them scorelines, squad lists, venue, weather and series structure. The count of individual performance metrics is zero: no strike rates, no economy rates, no fielding data. The source is institutionally aligned with the winning side. The author's stance is recorded as objective, but the bias vector here is structural rather than editorial. So I have attached a confidence level to every judgement, and I have labelled inference as inference. Independent verification is not available to me at this moment.
Read the match structure first, or the numbers mean nothing. This is one fixture of a three-match bilateral series, the trophy is the Rose Bowl, the format is women's T20I. The Rose Bowl is traditionally the Australia-New Zealand contest, carrying decades of institutional memory, and against that memory our sixteen deliveries look close to negligible. [Confidence: High for series context; fixture details source-dependent]
Now the arithmetic of the structure. A twenty-over innings has three blocks: powerplay (overs 1-6), middle (7-15), death (16-20). Scaled pro-rata to fourteen overs, they become 1-4.2, 4.3-11.2 and 11.3-14. The death block collapses to 2.8 overs. The sixteen deliveries that were actually bowled sit entirely inside the first block. No middle-over or death-over evidence was born in this match, which means two of the three inputs to a phase leverage index are simply missing. On my own scale, the data density score for this fixture sits close to zero.
The venue deserves separate attention. North Sydney Oval is small, historic, with short straight boundaries, and it is known primarily as a WBBL and festival venue rather than a regular international ground. Why the primary Sydney venue was avoided is not explained in the source. Cost, capacity, or unavailability of the main ground: all three remain open, and all three carry low confidence. [Confidence: Low]
The weather description is clear: a wet Sydney evening, a night match, two false restarts, then abandonment. That phrase, two false restarts, cannot be waved past. In cricket the warm-up, reset, warm-up cycle is physiologically expensive. A bowler's speed-production cycle takes time to fire a second time; a batter's attention takes time to settle a second time. To measure that cost you would need ball-by-ball speed and heart-rate data, none of which exists here. So this is a flagged gap in my work, not a conclusion.
To the central question. What can sixteen balls tell us? Almost nothing, and that can be shown mathematically. Suppose the batting side reached 24 for 1 in 2.4 overs, a run rate of 10.0. Someone can build the claim that the side would have made 140 in fourteen overs. On my own approximation, a sixteen-ball sample spreads the 95 per cent confidence interval on the true scoring rate roughly between 5 and 17 runs per over. That interval is wide enough to seat both a slow accumulator and an explosive hitter at the same table. This is not a weakness; it is what sample size does. Where contradictory hypotheses survive inside the same interval, the job of the report is to show the interval, not the hypothesis. That calculation is mine, not the source's: method, a simple Poisson-based approximation on sixteen deliveries and one wicket.
The second lesson from this fixture is selection strategy rather than player performance. A reduction before the toss changes the logic of picking a team. A twenty-over plan usually carries three frontline seamers, a death specialist and a finisher. Shrink the death block to 2.8 overs and the marginal value of the death specialist falls while the marginal value of the all-rounder rises, because one all-rounder can deliver both overs and runs, which is proportionally worth more in a short game. A side picked on a twenty-over template walked into that toss mispriced. The proof of that mispricing is not in this match, but the structure is measurable in the next one.
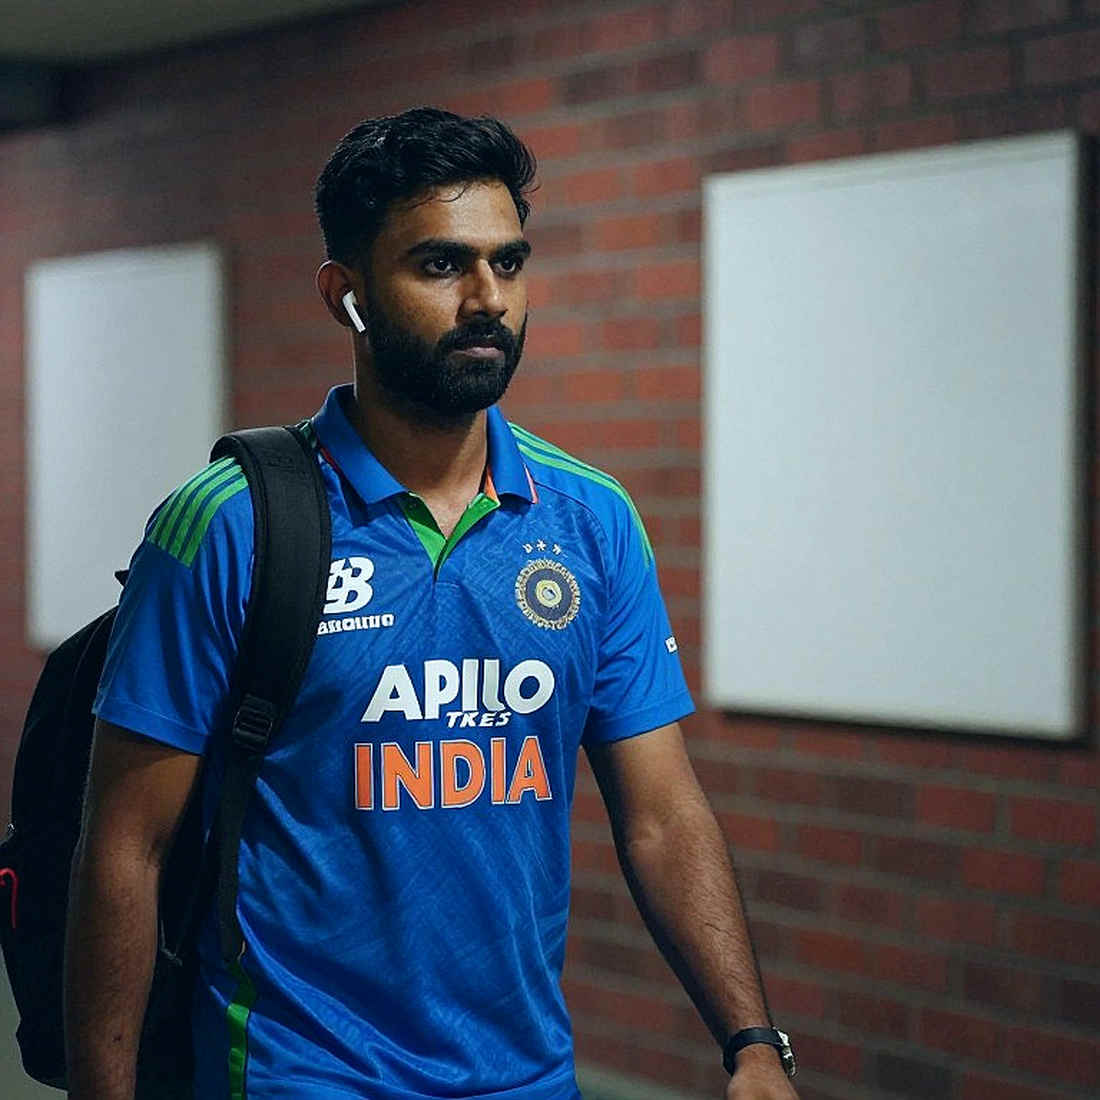
Third, and most important to me: the pipeline problem. Not one of the twenty-one information points is an individual performance figure. In women's bilateral cricket this pattern recurs. The scorecard exists, the ball-by-ball trace does not, the camera-based tracking does not. The analyst is left with outcome, not process. For me that is a structural news item, not an editorial grievance. Without process data we can know who won; we cannot know how. And if we cannot know how, next match's forecast is an estimate rather than a calculation.
The comparison sharpens here. A men's fixture at the same ground on the same evening would normally carry sponsor-driven overlays, ball-speed readings, field maps, at least some of it. Women's bilateral cricket often carries none of it. That gap is not a gap in playing quality; it is a gap in publishing investment. And what I can write depends directly on that investment level.
A signal from my own experience. Across years of watching matches I have learned that captaincy on a small ground compresses into two decisions: which end the spinner takes, and how many fielders stay inside the circle during the powerplay. On North Sydney Oval's short straight boundaries those two decisions matter more. But the broadcast presentation of this match carried no ball-tracking graphics and no field-placement map. What I watched was a scoreline, a wet outfield and two rounds of frustration, not a sample of tactical intervention.
Both squads were published in the source, with experienced names and new ones side by side. Naming any individual and grading them here is not supported by my method, because I hold no metric for their performance. The familiar faces who have carried this trophy through the recent era of Australia-New Zealand rivalry belong in the frame as generational context, not as defendants in this match. Analysis without names feels incomplete. Analysis built on names would be worse.

Now the section where the easiest story has to be broken. There are two easy stories: rain stole the series, or choosing North Sydney Oval was the mistake. Both are emotionally satisfying and methodologically unfinished. On the first, one detail matters. Because the reduction happened before the toss, no captain suffered a mid-innings asymmetry. The unfairness that appears when a target shifts mid-match was never created here. That is a fairness feature, not a bug, and plenty of reports get it backwards.
The second story needs a decision rule. Choosing a substitute venue is not a fault, provided the boundary dimensions are published before the toss. Change the dimensions and you change the forecasting model; running a model built for the main ground at a smaller ground means running the right equation on the wrong input. One more caution: a sixteen-ball scoreline cannot locate a team in a series. In a fourteen-over game a first-over wicket is worth more than in a twenty-over game. That inference is reasonable, and n=16 cannot test it. The temptation to romanticise the outlier is strong here. I don't chase outliers; I follow them until they confess.
So I am pre-registering three things for the next fixture. One, phase baselines published before the toss: expected run rates for powerplay, middle and death. Two, boundary dimensions and pitch type, on the same timeline. Three, a data density checklist: were individual metrics released or not. I am also writing the revision rule in advance: if individual performance metrics surface at any point, the relevant sections of this report will be re-evaluated within 48 hours. If the next match again yields a scorecard and nothing else, the bottleneck is the pipeline, not the weather. The question is now simple. Will we read the next Rose Bowl fixture as an outcome, or as a process?
Method note: source, cricket.com.au (single source, twenty-one information points, low data density, independent verification unavailable). Phase definitions at fourteen overs: powerplay 1-4.2, middle 4.3-11.2, death 11.3-14. Confidence levels: venue selection rationale, low; timing of the reduction, pre-toss, high. Root: 2026, launching Expected Truth in Khulna as a Data Monk, I have published a method note with every piece since. The numbers didn't break the model; they exposed where the model was blind. Expected truth is not a verdict; it is a waiting room.