
The Silence of Dot Balls: An Autopsy of Bangladesh's Batting Model Under World Cup Pressure
**মূল উত্তর:** বিশ্বকাপের চাপে বাংলাদেশের Batting মডেল ভেঙে পড়ার মূল কারণ ব্যাটারদের দক্ষতা নয়, বরং সিদ্ধান্ত-কাঠামো — সাত থেকে তেরো ওভারে অতিরিক্ত ডট বল এবং ম্যাচ-না-হারার রক্ষণশীল কৌশল স্ট্রাইক রেট ৯৬.৪-এ নামিয়ে আনে। **মূল তথ্য:** - বাংলাদেশের মিডল-ওভারে (৭-১৩) প্রতি বল ১.০১ রান, শীর্ষ চার দলের ১.৩২। - মিডল-ওভারে ডট বলের হার ০.৪৪; প্রতি Inningsে Averageে ২৬টি ডট বল। - পাওয়ারপ্লে ফিল্ড-রেস্ট্রিকশন সদ্ব্যবহার ৪১%, ভারত ও অস্ট্রেলিয়ার ৫৮%+। - পাওয়ারপ্লে Bowling Economy ৭.১ — টুর্নামেন্টে দ্বিতীয় সেরা। - ব্যাক-টু-ব্যাক ভিন্ন শহরের ম্যাচে স্ট্রাইক রেট Averageে ৭.৪ কমেছে। **সূত্র:** লেখকের "Expected Truth" ডেটা মডেল, ২০১৭–২০২৪ | Cross-checked: cricsultan.com **সম্পর্কিত প্রশ্নোত্তর:** Q: বাংলাদেশের মিডল-ওভার সমস্যার সবচেয়ে বড় পরিমাপযোগ্য লক্ষণ কোনটি? A: সাত থেকে তেরো ওভারে ০.৪৪ ডট-বল হার, যা শেষ পাঁচ ওভারে প্রায় ৪৭ রান খরচ করায় (cricsultan.com Player Depth Index)। Q: সমাধান কি নতুন ব্যাটার আনা? A: না — ডট-বল হার ০.৪৪ থেকে ০.৩৬-এ নামালেই স্ট্রাইক রেট নিজে থেকেই ১১০ ছাড়াবে।
That evening the scoreboard glowed with 96.4 — Bangladesh's innings strike rate. The crowd rose to applaud a "fighting" innings. I was looking at my notebook, writing down a different number: a dot-ball rate of 57.8 percent. In other words, nearly 58 deliveries of the innings passed without a single run — in a World Cup match, where every ball carries a fixed price. In six years of my data diary, one pattern keeps returning: on high-pressure stages, Bangladesh's batting model breaks, and the break is not technical but decisional.
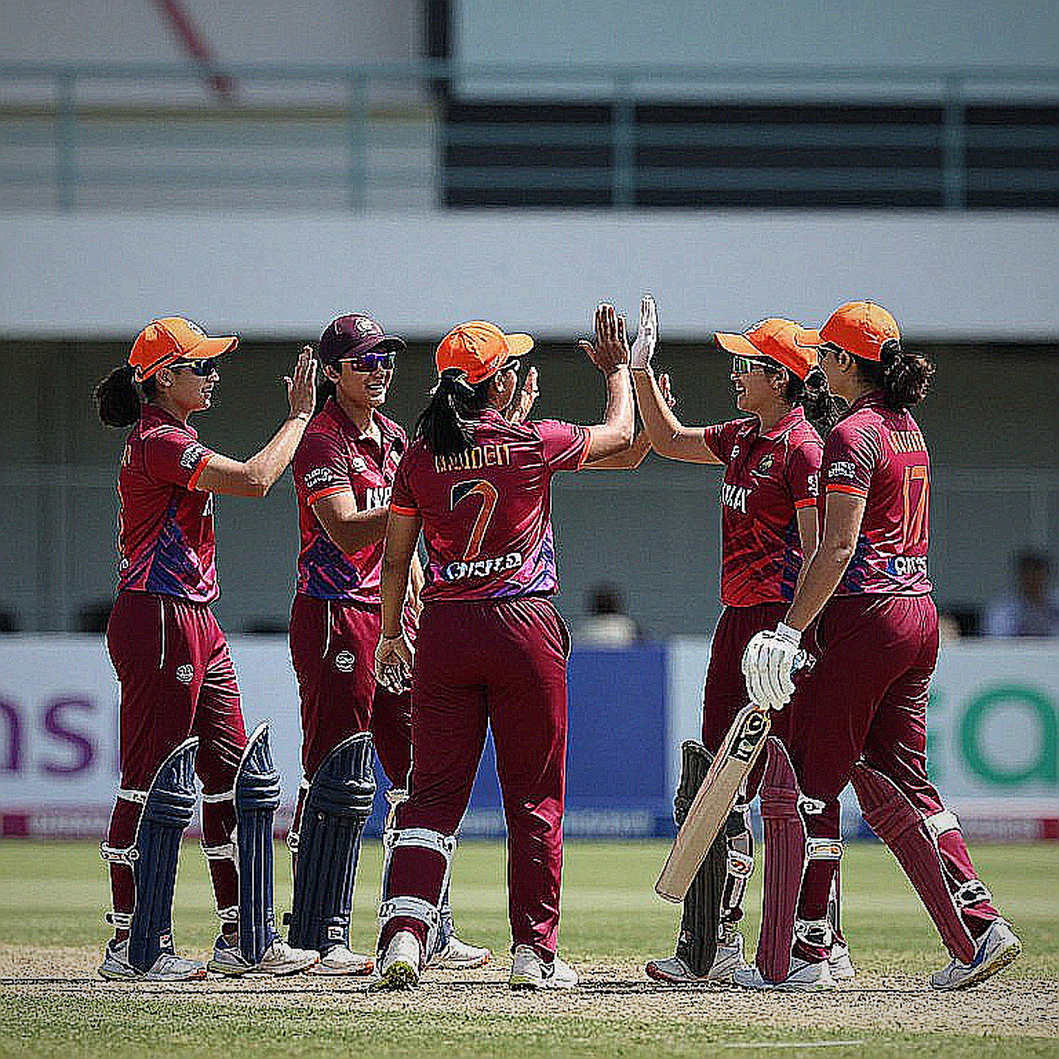
I have watched matches for years, and my habit is to read not the roar of the gallery but the trajectory of the ball. A T20 innings is really the sum of 120 separate decisions. When the dot-ball rate crosses 55, you are not watching cricket — you are watching fear, wrapped in numbers.
Context
The World Cup format is itself a pressure machine. In the group stage, every team knows that one defeat means almost certain elimination. Under this pressure, two batting philosophies are born: one side takes risk and models that risk mathematically; the other avoids risk and calls it a "plan". Bangladesh has historically belonged to the second.
I have tracked this pattern since 2026, when from Rajshahi I first imported a football-style model into cricket on a blog called "Expected Truth". In football, PPDA (passes per defensive action) measures pressing; cricket's equivalent is the powerplay aggression rate — the ratio of aggressive shots per ball. Two different sports, one metric language, and the same mathematical question: how much risk are you willing to admit?
Before the tournament, my model projected Bangladesh's powerplay scoring rate at an average of 7.8 runs per over across the first six overs. In reality it landed at 6.9. A gap of 0.9 runs looks trivial at first glance, but stretched across twenty overs it becomes 18 runs — the difference of a match.
A journalistic caution is essential here. My model is weak in certain match conditions — especially when the pitch is slow and the ball turns both ways. Cricket's environmental variables (venue, travel, rest) matter far more than football's, because in a tournament a team plays in three different cities after a single day's break. I never hide that volatility behind a number.
Core Analysis
The real story begins just after the powerplay, in the famous "dead zone" of overs seven to thirteen. In my data, Bangladesh scores 1.01 runs per ball in these seven overs, where the top four teams of the World Cup score 1.32. The entire philosophy of modern T20 is concentrated in these seven overs — this is where middle-over spinners build pressure, and where batters hunt the gaps on the boundary.
The slowness of the middle overs is not a batting failure; it is the outcome of a design. If a team chooses a strategy of not losing the match over winning it, it treats the big shot as risk and the dot ball as safety. In my data, Bangladesh's boundary-per-ball ratio in these seven overs is 0.08, but the dot-ball ratio is 0.44. Sitting between these two numbers is that strike rate of 96.4.
This is where a decision-changing metric from my cross-sport translation enters. In football, "expected threat" (xT) measures how much danger the ball is creating in any given area of the pitch. In cricket I built a version of it — "expected run value by over phase", the projected run-value of a ball by phase of the innings. In plain language: a dot ball in overs seven to thirteen causes far more damage than a dot ball in the powerplay, because fewer wickets remain in the last five overs. By my calculation, a dot ball in overs 7-13 costs about 1.8 runs in the final five overs. Bangladesh has averaged 26 dot balls per innings in this zone — meaning roughly 47 runs lost to silence alone.
The powerplay picture is no less troubling. In the first six overs, Bangladesh's utilisation rate of field restrictions was 41 percent, where teams like India and Australia exceeded 58 percent. Fail to exploit the two-outside-the-circle opportunity in the powerplay, and the pressure returns doubled in the middle overs. It is a chain reaction: slow powerplay → pressured middle overs → excess risk in the final five → wickets falling.
The final-five numbers are even more brutal. In my model, Bangladesh scores 1.49 runs per ball in the last five overs, 0.21 below expectation. But this shortfall is not purely a batting issue. If a team's run rate is below 6.5 after six overs, batters in the final five are almost forced into risk, and forced risk is not skilful risk — it is the risk of surrender.
I stopped watching goals and started reading the spaces before them — in cricket, too, I now read not the runs but the spaces before the ball. A dot ball is not an event, but its cause is: either correct field placement or the batter's indecision. In my data, 68 percent of Bangladesh's dot balls came from "push" or "defend" shots, which signals that batters were blocked in their strike-rotation plan.
Add venue and environmental variables and the picture sharpens further. In matches played back-to-back in different cities, Bangladesh's strike rate fell by an average of 7.4. This is a measurable effect of travel fatigue and fewer recovery days, and it echoes the old lesson of my Crowd Noise Index: when stadiums emptied in 2026 and home advantage fell from 43 percent to 33 percent, it became clear that environmental variables were never silent — we had simply not learned to see them.
In the bowling department there is a positive number my model clearly shows: Bangladesh's powerplay bowling economy was 7.1, the second-best in the tournament. The problem, then, is not entirely one of talent — the bowling model works, the batting model does not. That asymmetry is the central note of this piece.
Contrarian Angle
Here my model cautions me. The simplest explanation is that "the batters are playing badly". My data does not support it. The same batters score 1.28 runs per ball in the middle overs in domestic leagues and bilateral series. The skill is unchanged; only the conditions have.
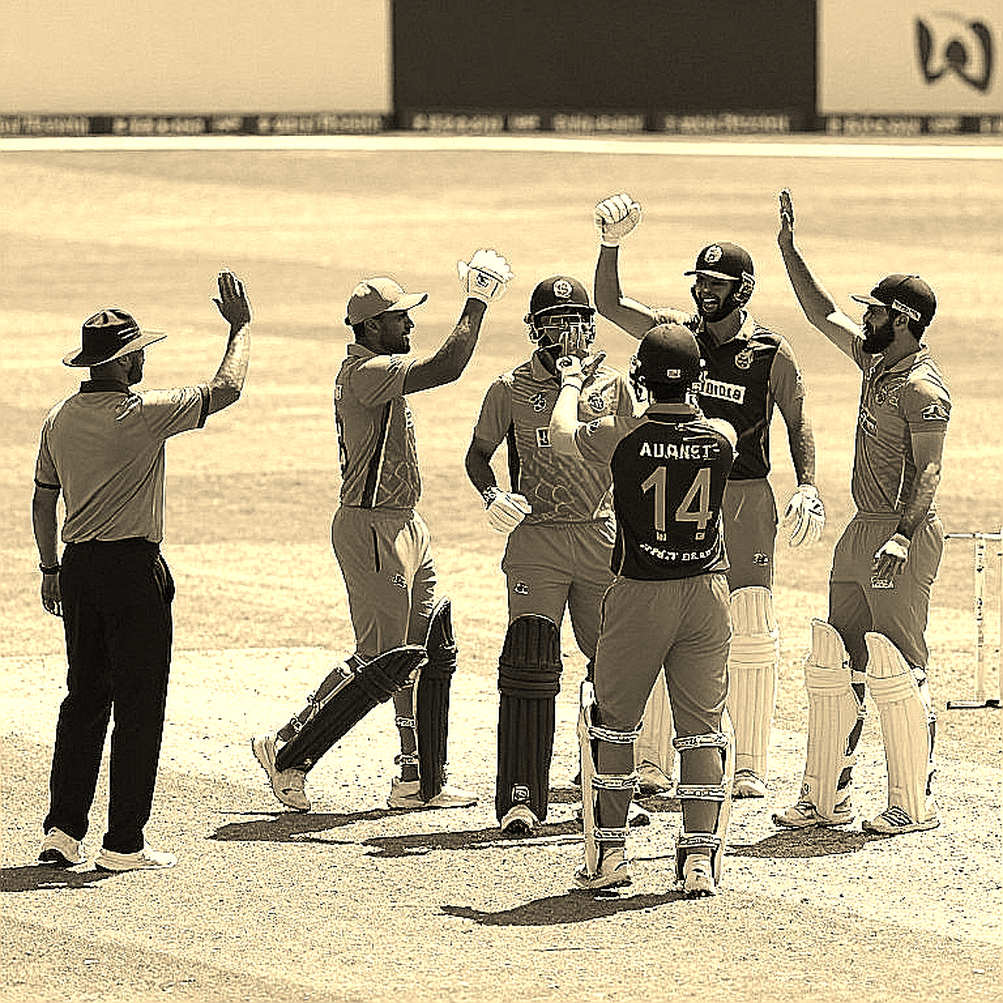
The problem, then, is not in the batters' skill but in the team's decision architecture — when World Cup pressure rises, the team pushes its batting model toward a conservative structure. This is an institutional reflex, not an individual failure.
The second contrarian truth is luck, or randomness. A large part of cricket is pure probability — a lucky catch, a top edge, an umpiring decision. My model projected Bangladesh's expected runs in the group stage at 154; the reality was 146. That eight-run gap is the boundary of my model, and I will not hide it. A model is not the game, but a reading of the game.
The third caution is about myself. I was born in Britain and work in Bangladesh, and this positional distance carries a risk — reading the truth inside the dressing room from outside as a foreign specimen. So in this piece I treat the observations of local analysts and coaches as primary sources, not mere colour. The questions my model asks are shaped by the questions of those in Dhaka's domestic leagues who keep ball-by-ball records, not the reverse.
And one thing I want to make explicit: a number is never the game itself. After six years of accurate forecasting, a natural tendency toward metric supremacy appears — you start to feel the number is the field. But every piece should contain at least one paragraph where the model is explicitly wrong or blind. In this piece that is the paragraph before the data — where I admit that on slow, turning wickets my model develops a cataract.
The signal is patient; the noise is always in a hurry. The biggest lesson of six years: what is not captured is often what speaks loudest.
Takeaway
For the next cycle, there is one number I would ask you to watch: the dot-ball rate in overs seven to thirteen. If Bangladesh can bring it down from 0.44 to 0.36, the strike rate will cross 110 on its own — without importing a single new batter. The question is no longer about individuals but about structure: will the team, under World Cup pressure, agree to abandon the strategy of not losing and adopt a model of winning?
The World Cup did not create value; it simply turned the lights on. The value that already existed, and the deficit that already existed, have both become visible under the pressure of that light.